

From data to insight and action
Reporting & Analysis
Data only gains value when people can work with it. Victa helps organizations translate data into clear reports and analyses that align with the information needs of users and the goals of the organization.
From management dashboards to in-depth analysis, and from operational reporting to automation: we ensure that the right information is available at the right time and is actually used.
Discuss your issue
Get more out of your data
Perhaps reporting currently takes a lot of time, there is a lack of a clear overview, or dashboards already exist but are not being used sufficiently. Whatever the situation, a good solution does not start with the technology, but with what your organization needs.
We map out information needs, users, and bottlenecks, and translate these into a suitable solution. In doing so, we look beyond just reports. This results not only in a technical solution, but a way of working that truly helps your organization move forward.
Insight
Gain insight into key developments, performance, and KPIs with dashboards, analyses, and reports in Power BI, among others, and Qlik.
Apps
Support and digitize business processes with user-friendly low-code apps that align with daily practice.
Automation
Automate recurring and manual tasks so that processes run more efficiently and employees have more time for work that adds value.
Adoption
Ensure employees understand and use data with training, workshops, demos, and guidance tailored to different users.
From overview to detail: the right information for every user
Executives view data differently than a manager, analyst, or employee on the shop floor. Therefore, not everyone needs to see the same dashboard or the same amount of information. At Victa, we look at the different information needs within the organization. To do this, we use the CDAR principle: Cockpit, Dashboard, Analysis, and Reporting.
Cockpit
Gain insight into the most important KPIs across various parts of the organization at a glance. Focused on strategic guidance and overview.
Dashboard
Targeted insight into performance and KPIs within a specific domain, such as Finance, Sales, HR, or Operations.
Analysis
Dive deeper into the data to discover trends, developments, anomalies, and possible causes.
Reporting
View the underlying details and information needed for further analysis or daily work.
This way, every user can start at the level that is relevant to him or her and, where necessary, dive deeper and deeper into the data.

Reports that not only work, but are pleasant to work with.
A dashboard may be good in terms of content, but if users do not understand where to look or if every report is structured differently, it remains difficult to make data part of daily work.
Therefore, we work with BI templates in which we make agreements regarding structure, navigation, and design, among other things. We align these with your organization's corporate identity and working methods.
This creates a recognizable and consistent environment in which users can find their way more quickly. At the same time, it forms a solid foundation for new reports and self-service BI, so you don't have to start from scratch every time.
Make data part of your business process
Sometimes, simply seeing what is happening is not enough. You also want to be able to do something based on that insight.
Therefore, we can combine reporting and analysis with apps and automation. With low-code apps, for example, employees can capture, verify, or supplement information. We can then automate recurring tasks and processes with technology such as Power Automate en Qlik Automate.
This creates a logical process in which data not only shows what is happening but also helps employees take the right next step faster.

From problem to a solution that is used
Our approach
No organization or information need is the same. That is why we develop solutions together with the people who will be working with them. Through this approach, users remain involved, and we build not only what was conceived beforehand, but, more importantly, what proves to be needed in practice.
We map out the need
We determine the right solution
We are developing step by step
We ensure that it works in practice.

A dashboard only has value if it is used.
New technology alone does not make an organization data-driven. Employees must know where to find information, understand what they see, and have the confidence to trust it.
Therefore, we pay attention to adoption, education, and data literacy during and after a project. From end users and analysts to BI developers, key users, and management: every target group requires a different approach.
Through training courses, workshops, demos, and roadshows, we help employees use data increasingly independently in their daily work.
Technology that suits your organization
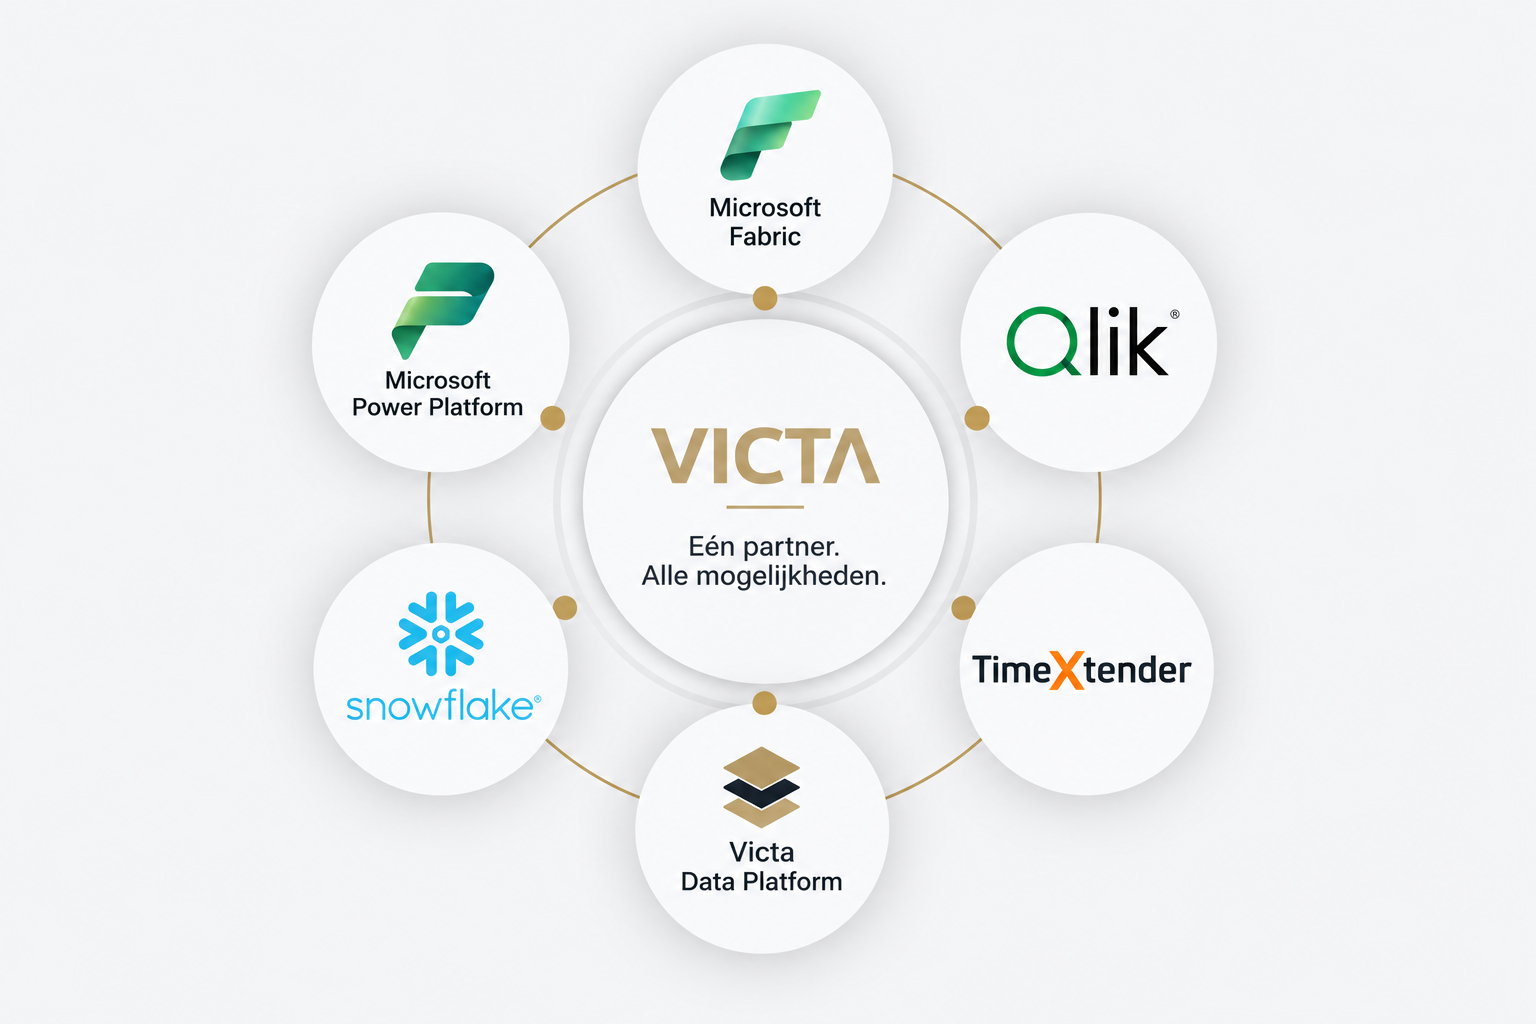
We work with various technologies for reporting, analysis, apps, and automation, including Microsoft Power BI, Qlik, Power Apps, Power Automate and Qlik Automate.
In this approach, the focus is not on the technology, but on your challenge. We look at which solution fits your existing environment, users, ambitions, and the way you want to continue growing.
Curious how you can get more out of your data and reports?
A good report does not just answer the question of what is happening. It helps you understand why something is happening and what you can do next.
Victa brings together reporting, analysis, apps, automation, and education. In this way, we help you move step by step from isolated insights to an organization where data actually becomes part of decisions and daily processes. Get in touch and brainstorm with an expert!